Chapter 5 Strategy with Fibonacci Ratios
When price has run up a lot, we know it will pull back, and should expect a pullback to happen at any minute. So if we enter an LP position from the top with only stables, setting the upper limit right below the current price, we will feel confident that the position will start earning fees pretty soon. But where to set the lower limit? It’s a tough question because we don’t know how bad the pullback will be. If the pullback will be mild and short-lived, we want to set the lower limit 10 ~ 27% 36 below the upper limit to enjoy a juicy yield and get out with stables intact when price bounces back up. But if the pullback will be severe and prolonged, a range width of 10 ~ 27% will be deadly because price will fall below the lower limit so much that in order to unwind and get back the same amount of stables, we will need to LP the volatile coin in an ultra-wide position with the upper limit reaching the sky, resulting a pitiful yield and prolonged worry that price will never rise again. This happened to me more times than I like so I started looking for better ways of setting the lower limit, and I might’ve found one. As you read the rest of this chapter, keep in mind that the strategy presented here is experimental. I only started using it recently and have no data yet to tell whether it works or not.
When to Use This Strategy
Use this strategy after token price has a good upward run, specifically, when current price \(\geq\) the previous top. Definitely try this strategy if price hits all time high (ATH).
Strategy Description
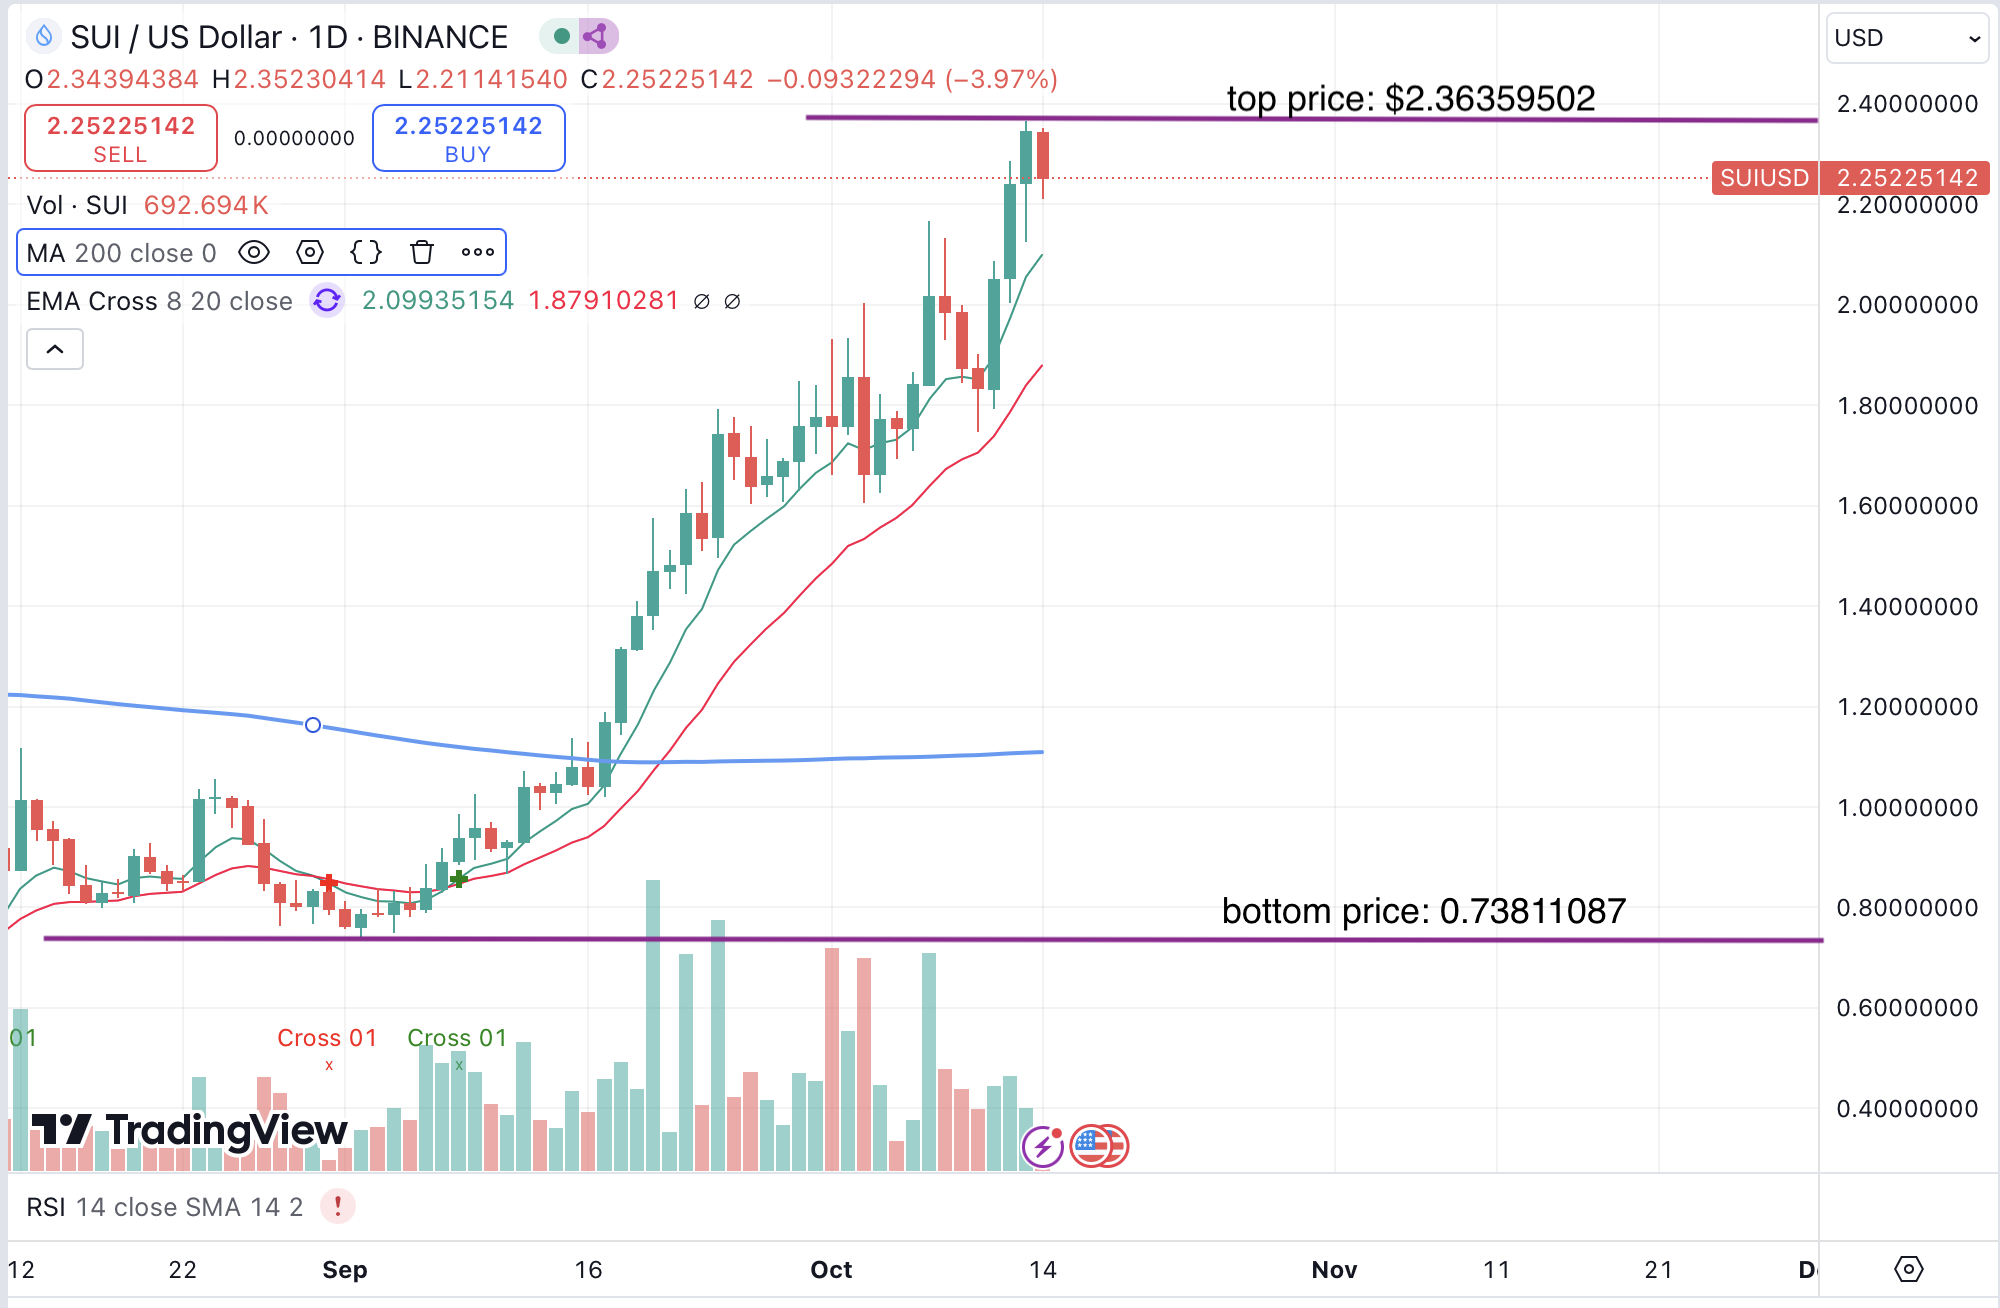
- Find the bottom and top prices of the upward run and denote them as \(P_{min}\) and \(P_{max}\) respectively. For example, the following chart captures an upward trend of SUI price, with \(P_{min}=0.73811087\) and \(P_{max}=2.36359502\).
- Calculate price levels corresponding to these Fibonacci ratios: 0, 0.236, 0.382, 0.500, 0.618, 0.786, and 1. These price levels are called Fibonacci retracement levels because price tend to retrace to these levels and form support there and bounce back up from there. Let \(\alpha\) denote Fibonacci ratio and \(d\) denote the difference between the top and bottom prices, i.e., \(d = P_{max} - P_{mix}\), we can then calculate the Fibonacci retracement level at \(\alpha\) as follows, \(P_{\alpha} = P_{max} - d * \alpha\). For example, the table below lists the Fibonacci retracement levels for the above mentioned SUI example.
| \(\alpha\) | price | % drop from top price |
|---|---|---|
| 0.000 | $2.36359502 | 0.00% |
| 0.236 | $1.97998076 | -16.23% |
| 0.382 | $1.74266007 | -26.27% |
| 0.500 | $1.55085295 | -34.39% |
| 0.618 | $1.35904582 | -42.50% |
| 0.786 | $1.08596448 | -54.05% |
| 1.000 | $0.73811087 | -68.77% |
When price is at or a bit below \(P_0\), deploy the following triplets at the same time:
- strat 500: LP stables one-sided, setting max at current price and min at 0.500 fib level.
- strat 618: LP stables one-sided, setting max at current price and min at 0.618 fib level.
- strat 786: LP stables one-sided, setting max at current price and min at 0.786 fib level.
For example, the following table shows the setup of my positions for the above SUI example.
| strategy | min | max | % drop from max | dca price | current fee APR |
|---|---|---|---|---|---|
| strat 500 | $1.55282 | $2.25254 | -31.06% | $1.8702 | 177.79% |
| strat 618 | $1.36081 | $2.23906 | -39.22% | $1.7455 | 137.12% |
| strat 786 | $1.08339 | $2.23906 | -51.61% | $1.5575 | 99.54% |
Note that the max values were “current prices” at the time when I opened those positions and they are all less than are less than \(P_0\) ($2.36359502). The min values are not exactly the fib retracement levels because the liquidity pool does not use exact fib levels as boundaries for its liquidity curves. That’s ok in practice, just pick boundaries closes to the fib levels, a little above or below is fine. Let me also remind you that we calculate dca price by taking the squared root of the product of min and max prices. For example, \(\sqrt{1.55282*2.25254}=1.870238\).
If and when price falls near \(P_{0.236}\), deploy the following triplets at the same time:
- strat 236-618: LP stables one-sided, setting max at 0.236 fib level and min at 0.618 fib level.
- strat 236-786: LP stables one-sided, setting max at 0.236 fib level and min at 0.786 fib level.
- strat 236-1000: LP stables one-sided, setting max at 0.236 fib level and min at 1.000 fib level.
This scenario hasn’t happened to the above SUI example. Nonetheless, we can plan the setup as follows:
| strategy | min | max | % drop from max | dca price | |
|---|---|---|---|---|---|
| strat 236-618 | $1.36081 | $1.97998 | -31.27% | $1.641456 | |
| strat 236-786 | $1.08339 | $1.97998 | -45.28% | $1.464613 | |
| strat 236-1000 | $0.73795 | $1.97998 | -62.73% | $1.208771 |
This range of numbers is from the many LP positions I did during a bear market and the transition period from the bear market to a bull market. Most of those positions had a range width of 20 ~ 27%, where range width = upper limit / lower limit - 1.↩︎
Welcome
Log in to access this book.