Chapter 8 Ladder of Positions
A ladder of positions, dynamic and lean—
Price falling? Pull from above and lend; add new below.
Price climbing? Unlend and add new above.
Concentrated liquidity provision is an optimization challenge. When everything else is equal, a tight price range earns more fees per hour than a wide one, but has a shorter in-range duration because it’s easier for price to exit a narrow band. Conversely, a wide range has a longer in-range duration but earns less fees per hour. So when everything else is equal, there’s an inverse relationship between fees earned per hour and in-range duration. The goal is to maximize fees, which is the product of fees earned per hour and in-range duration, constrained by a limited amount of capital. In this chapter, I’ll present what I consider to be the simplest strategy for solving this problem: creating a ladder of positions between support and resistance levels. Think of each position as a rung on a ladder. Add new rungs below as price falls. Remove old rungs from the top as price climbs. Follow the price and always have some capital in range.
Before diving into the details, it’s important to note that this strategy’s success hinges on three things:
- identifying strong support/resistance levels,
- existence of strong upward price momentum, and
- efficient capital tranches.
Item 1 is a skill that can be acquired. Item 2 requires you to pick coins that don’t go to zero. Bitcoin56 is probably the only coin that won’t go to zero in the long run. SOL, ETH, SUI, and Fartcoin will most likely not go to zero in 2025, and they often have LP yields higher than BTC. Item 3 depends on your support/resistance levels and is influenced by price movement. On one hand, even if you draw bad support levels and concentrate too much capital in one tranche at a higher price, you will do well as long as price doesn’t dump. Conversely, you can draw a strong support level and spread your capital nicely into several tranches in descending order of price, but if price nukes through all these tranches, you will run out of dry powder and get trapped.
8.1 Demo: Building a Ladder of SOL-USDC Positions
Constructing a ladder of LP positions is simpler with Meteora’s DLMM pools than UniV3 pools. With each position limited to 69 bins, which define a consistent maximum width for all positions in the same pool, we can just:
- choose the highest-yield pool, and
- stack/unstack max-width positions in this pool as price goes down/up.
Take the Bin Step 4 Fee 0.04% SOL-USDC pool for example. It generates the
highest 24h yield day after day for months compared to other SOL-USDC pools.
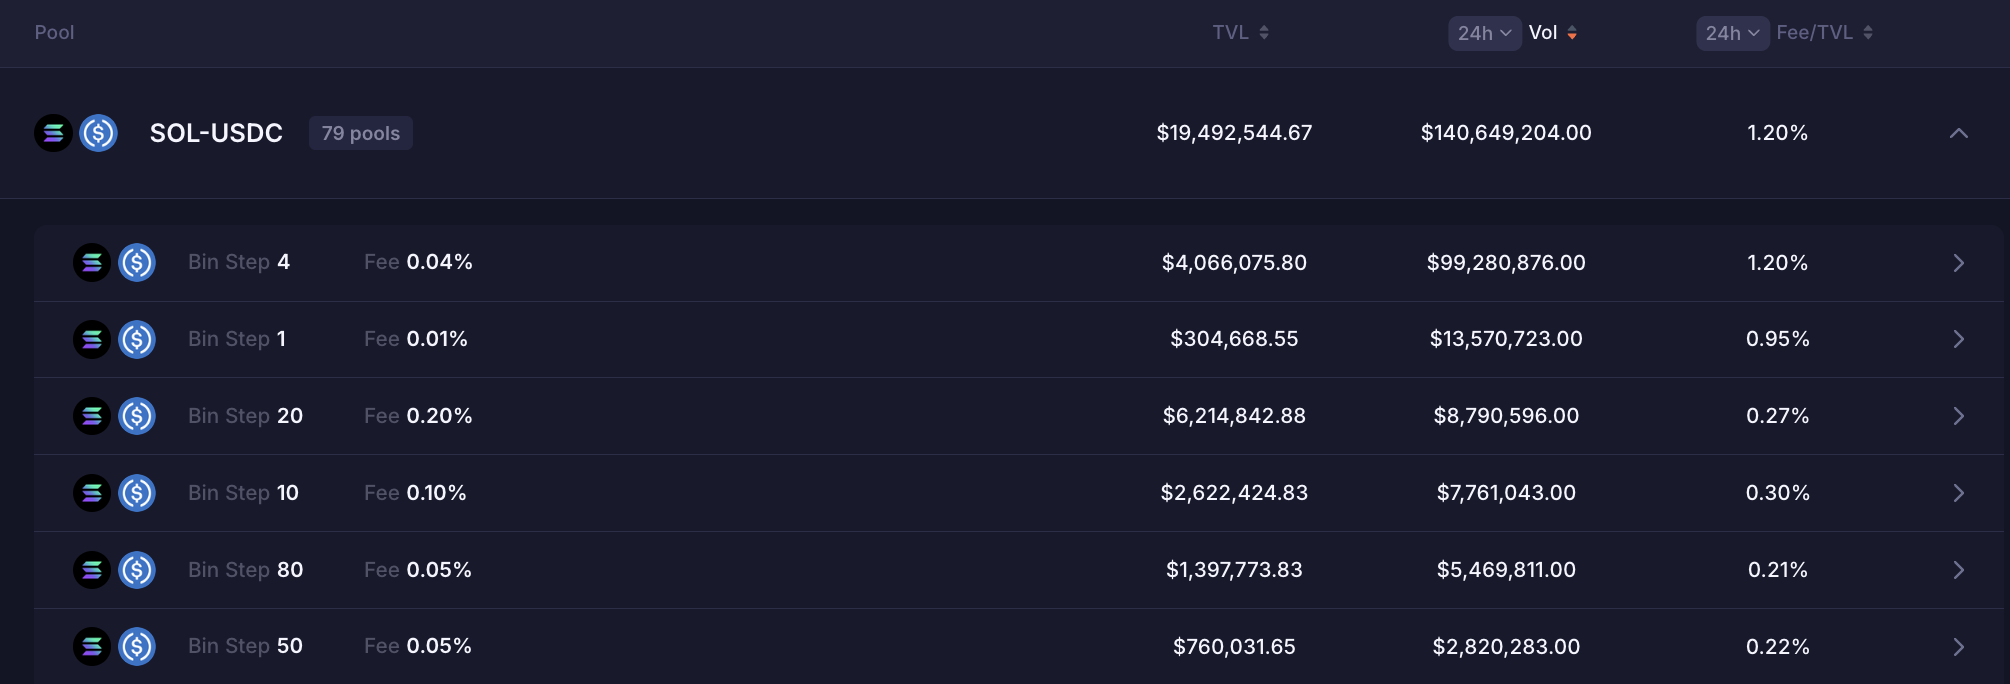
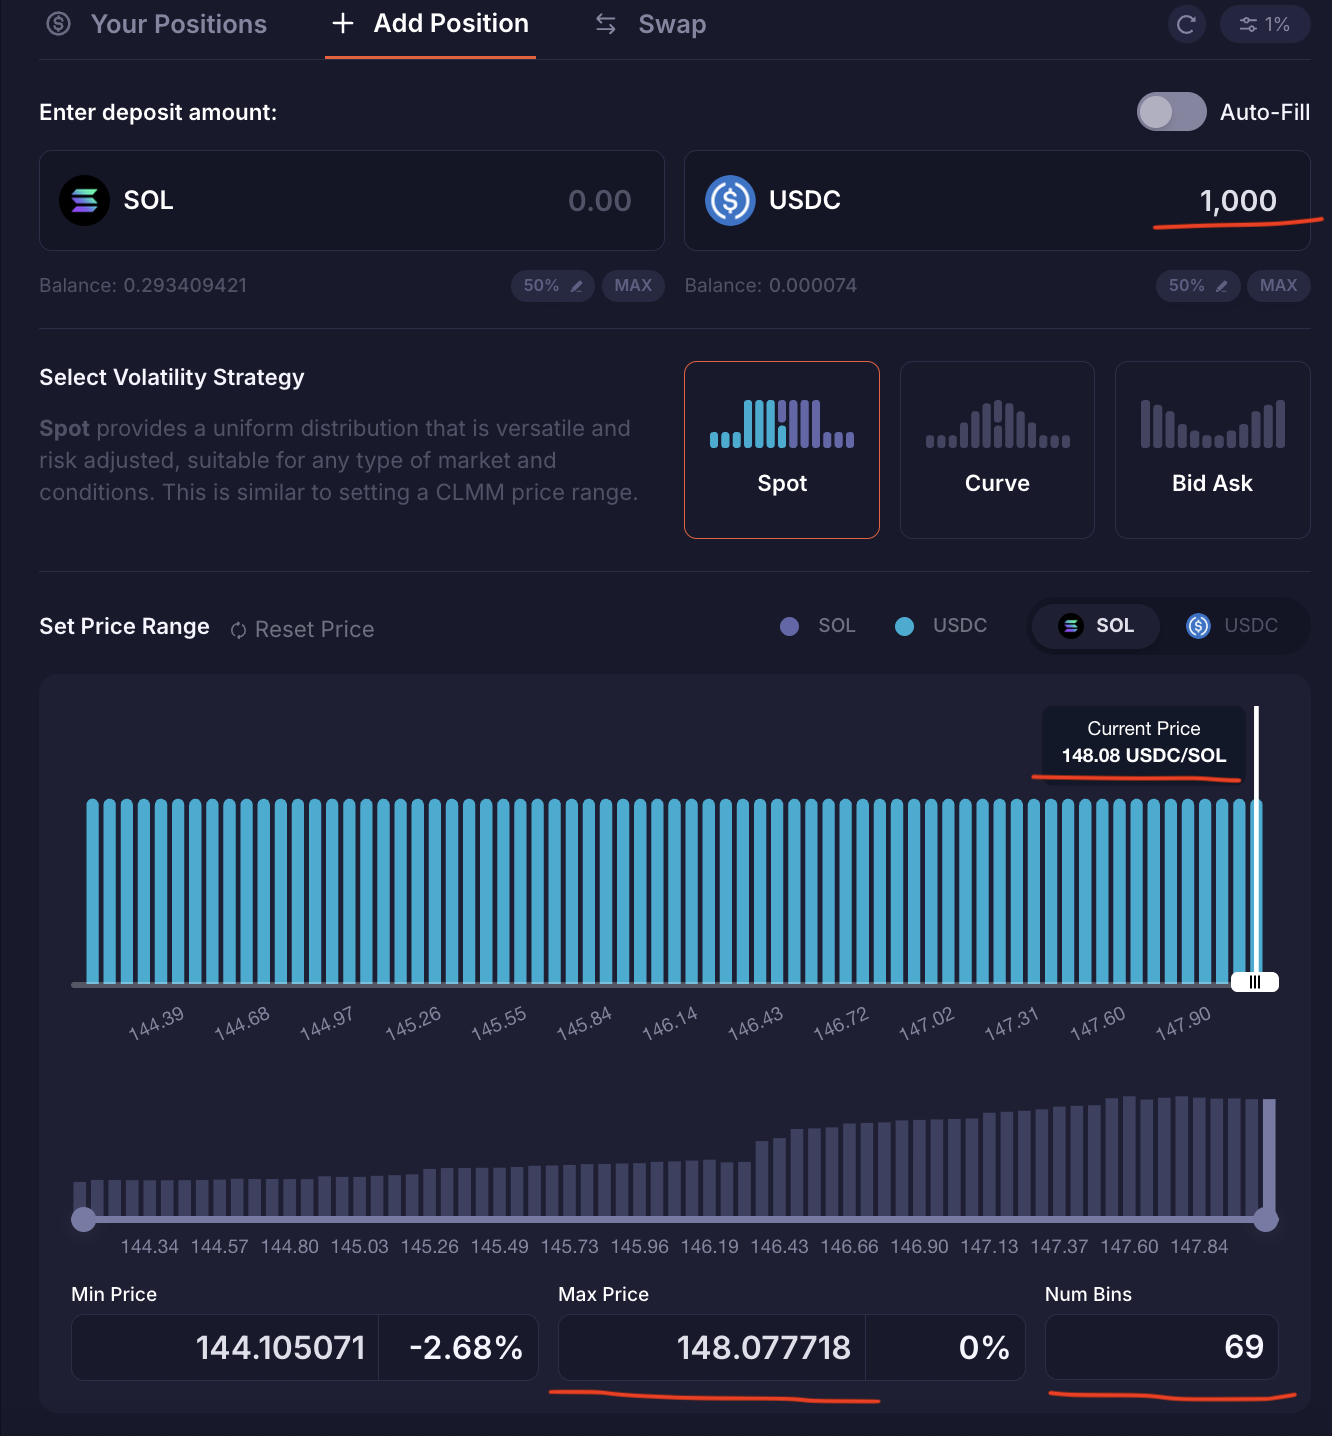
Each max-width position in this pool covers a 2.68% price drop or 2.76% price jump. Concentrating our entire USDC bag into a single position would create too much risk and not enough reward: (1) We’d stop earning fees if SOL drops more than 2.68%, which happens easily all the time, and (2) prolonged downward price action could leave us holding SOL with a negative (unrealized) PnL and without any yield. So we want to tranche our capital across multiple positions deployed sequentially as the price declines.
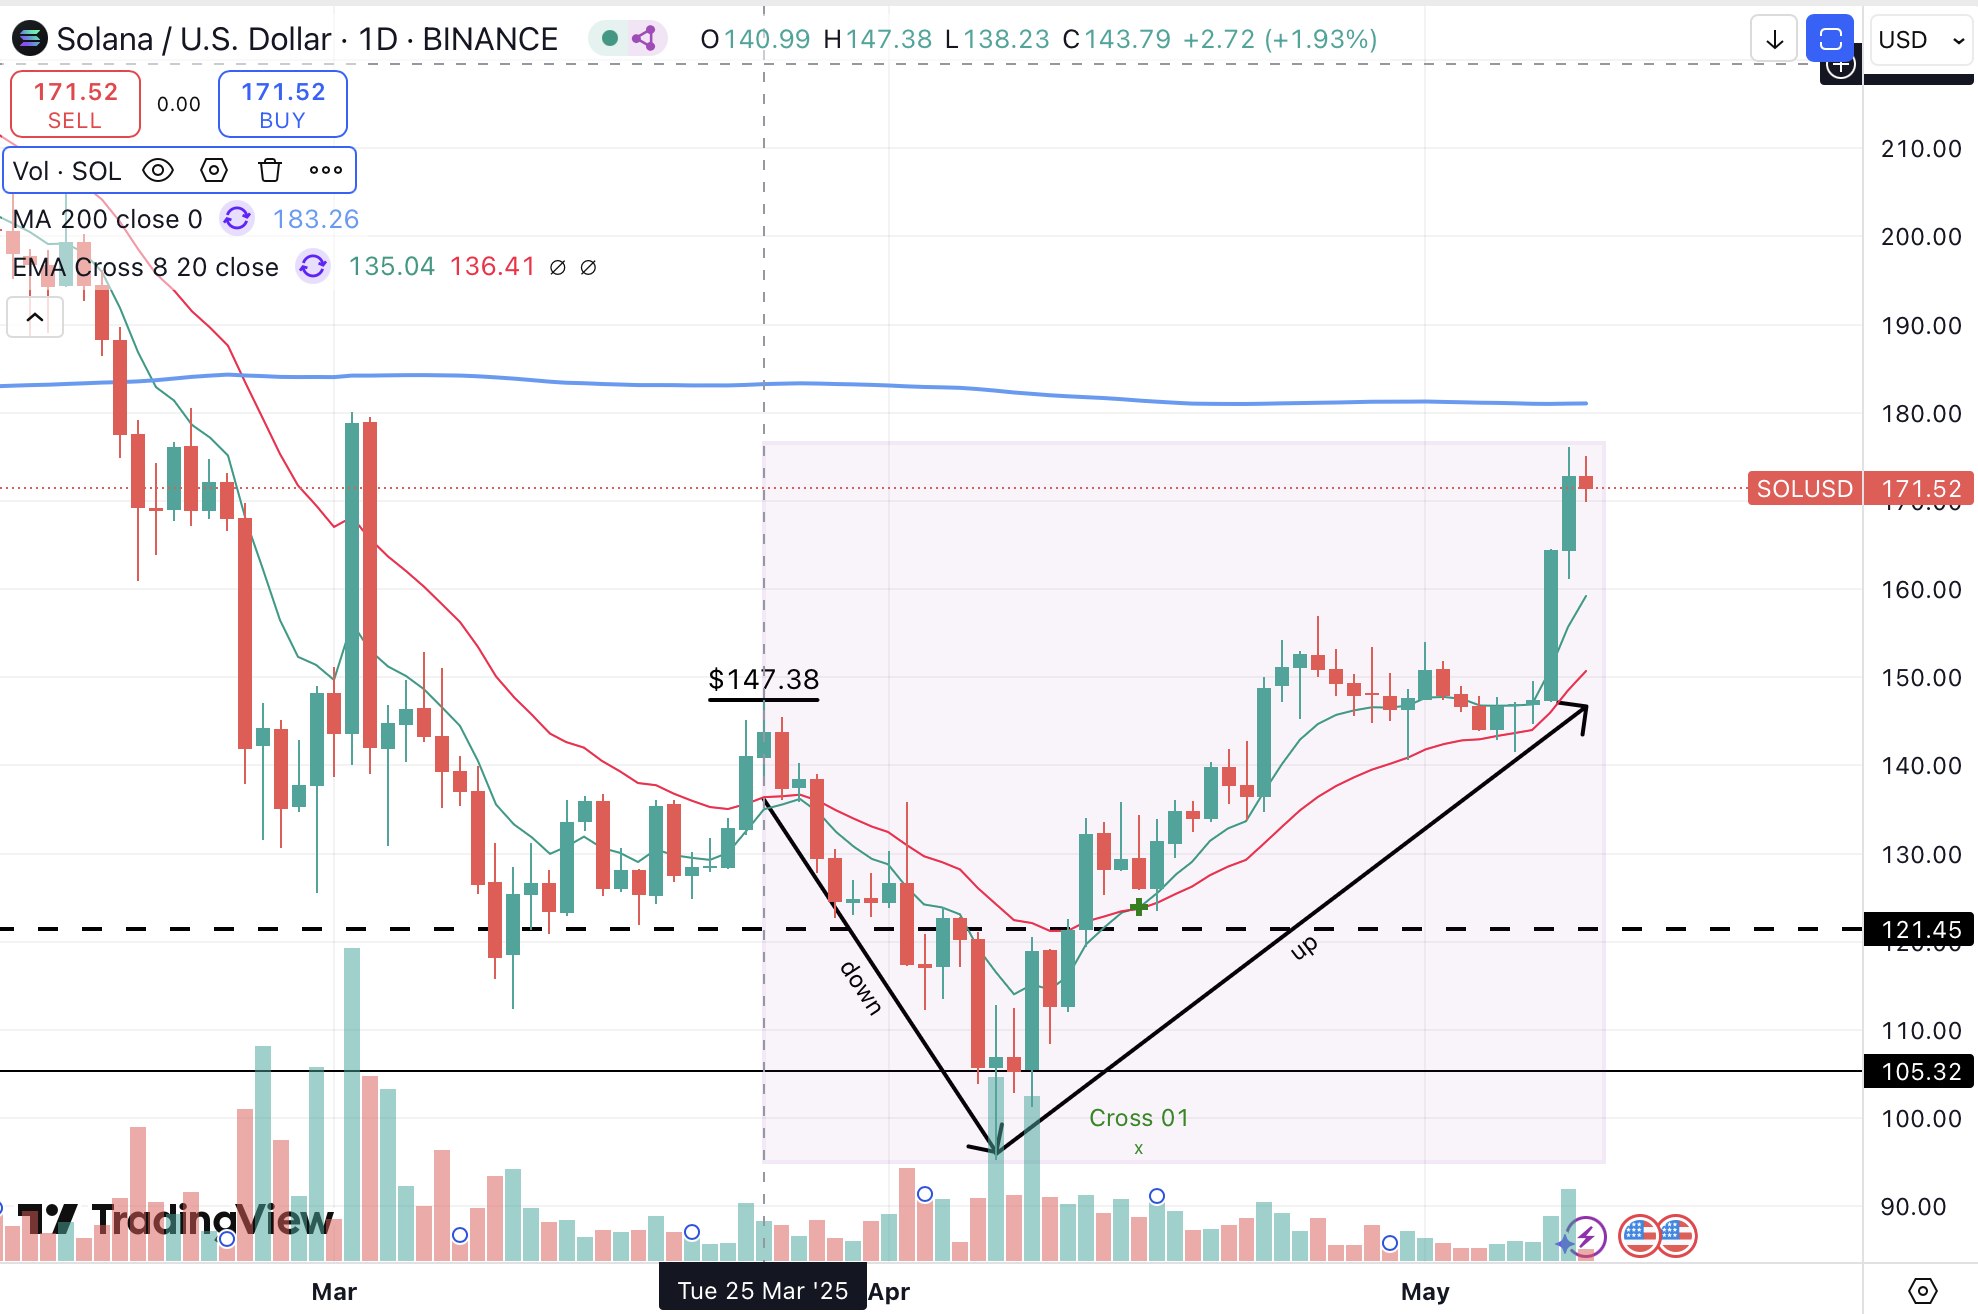
Concretely, suppose today is 25 March 2025, and we have 10,000 USDC for CLP. We watched SOL make a new high at $147.38, and as the price started falling, we rushed to open a position between $146.72192 and $142.785647 with 1,000 USDC from the top57. We then supplied the remaining 9,000 USDC to Kamino58 to earn a 4% interest rate. Now that we don’t have any idle capital sitting around, we can take some time to think things through and plan the next steps:
If price moves above $146.72192, we will withdraw USDC liquidity and close the position and open a new one at a higher price.
If price drops below $142.785647, we will withdraw some USDC from Kamino to open another single-sided position. By playing with
Min PriceandMax Priceon theAdd Positiontab, we find that the bin right below (or to the left of) $142.785647 sits at $142.728556. If we don’t want any gaps, we should open the next position between $142.728556 and $138.899417. We will also want to deploy more than 1000 USDC in this new position because of the lower price of SOL.If price further drops below $138.899417, we will add another position below with yet more USDC. We will also close the first position and supply the returned SOL to Kamino. We will keep doing it until price bottoms. In order to determine the amount of USDC to deploy for each position, we need to predict where price will bottom. The more correct we are, the more optimal we can allocate capital. Because price often bottoms near support levels defined by historical prices, it’s important to master the art of identifying strong support levels59.
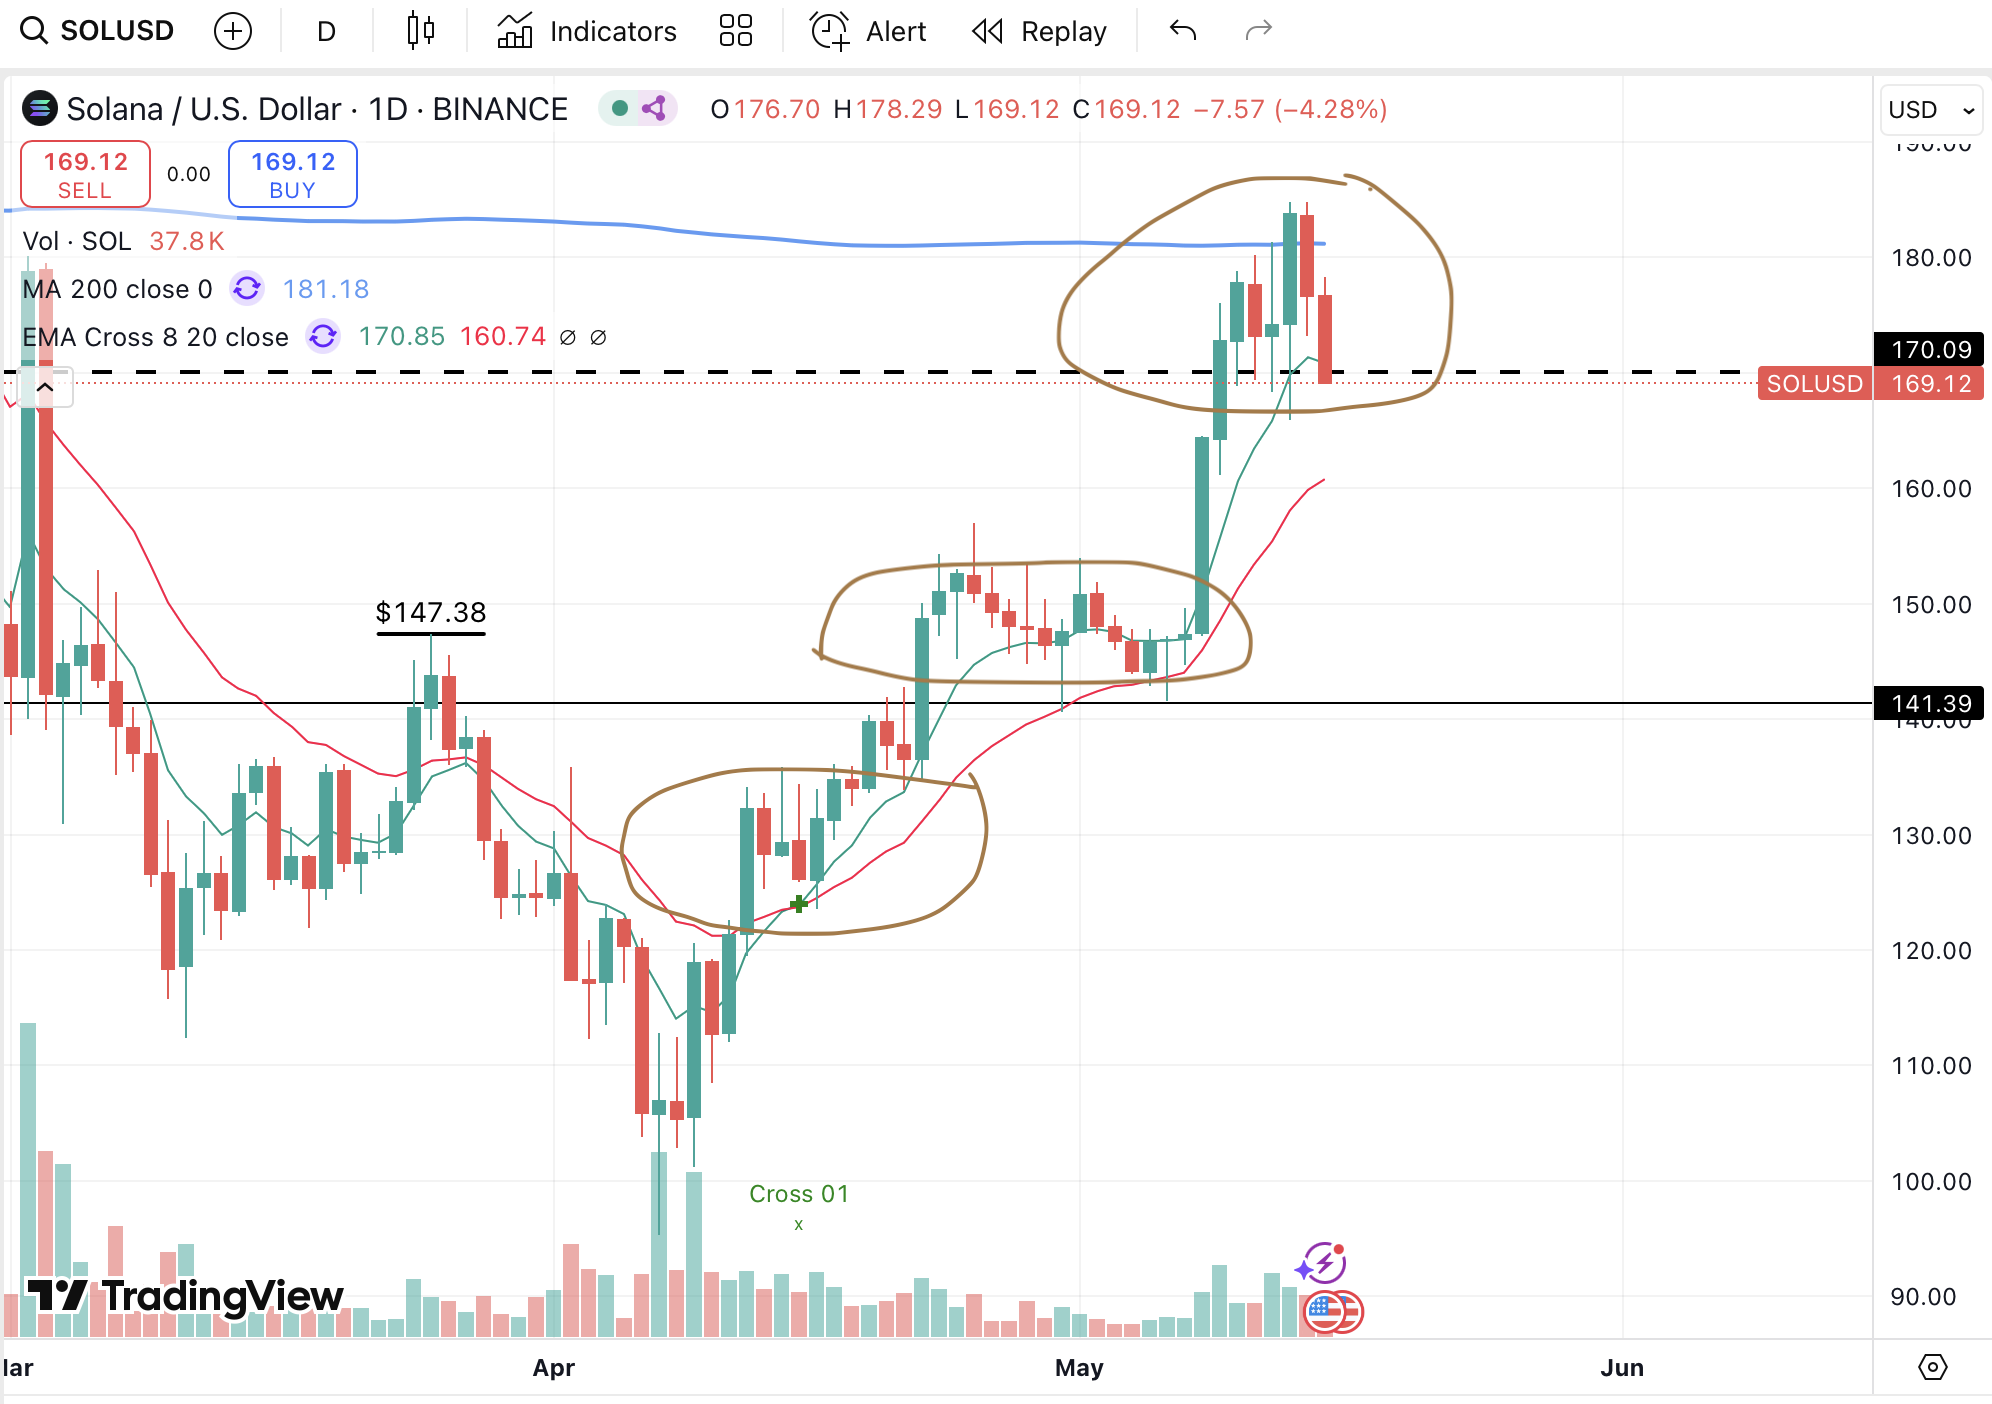
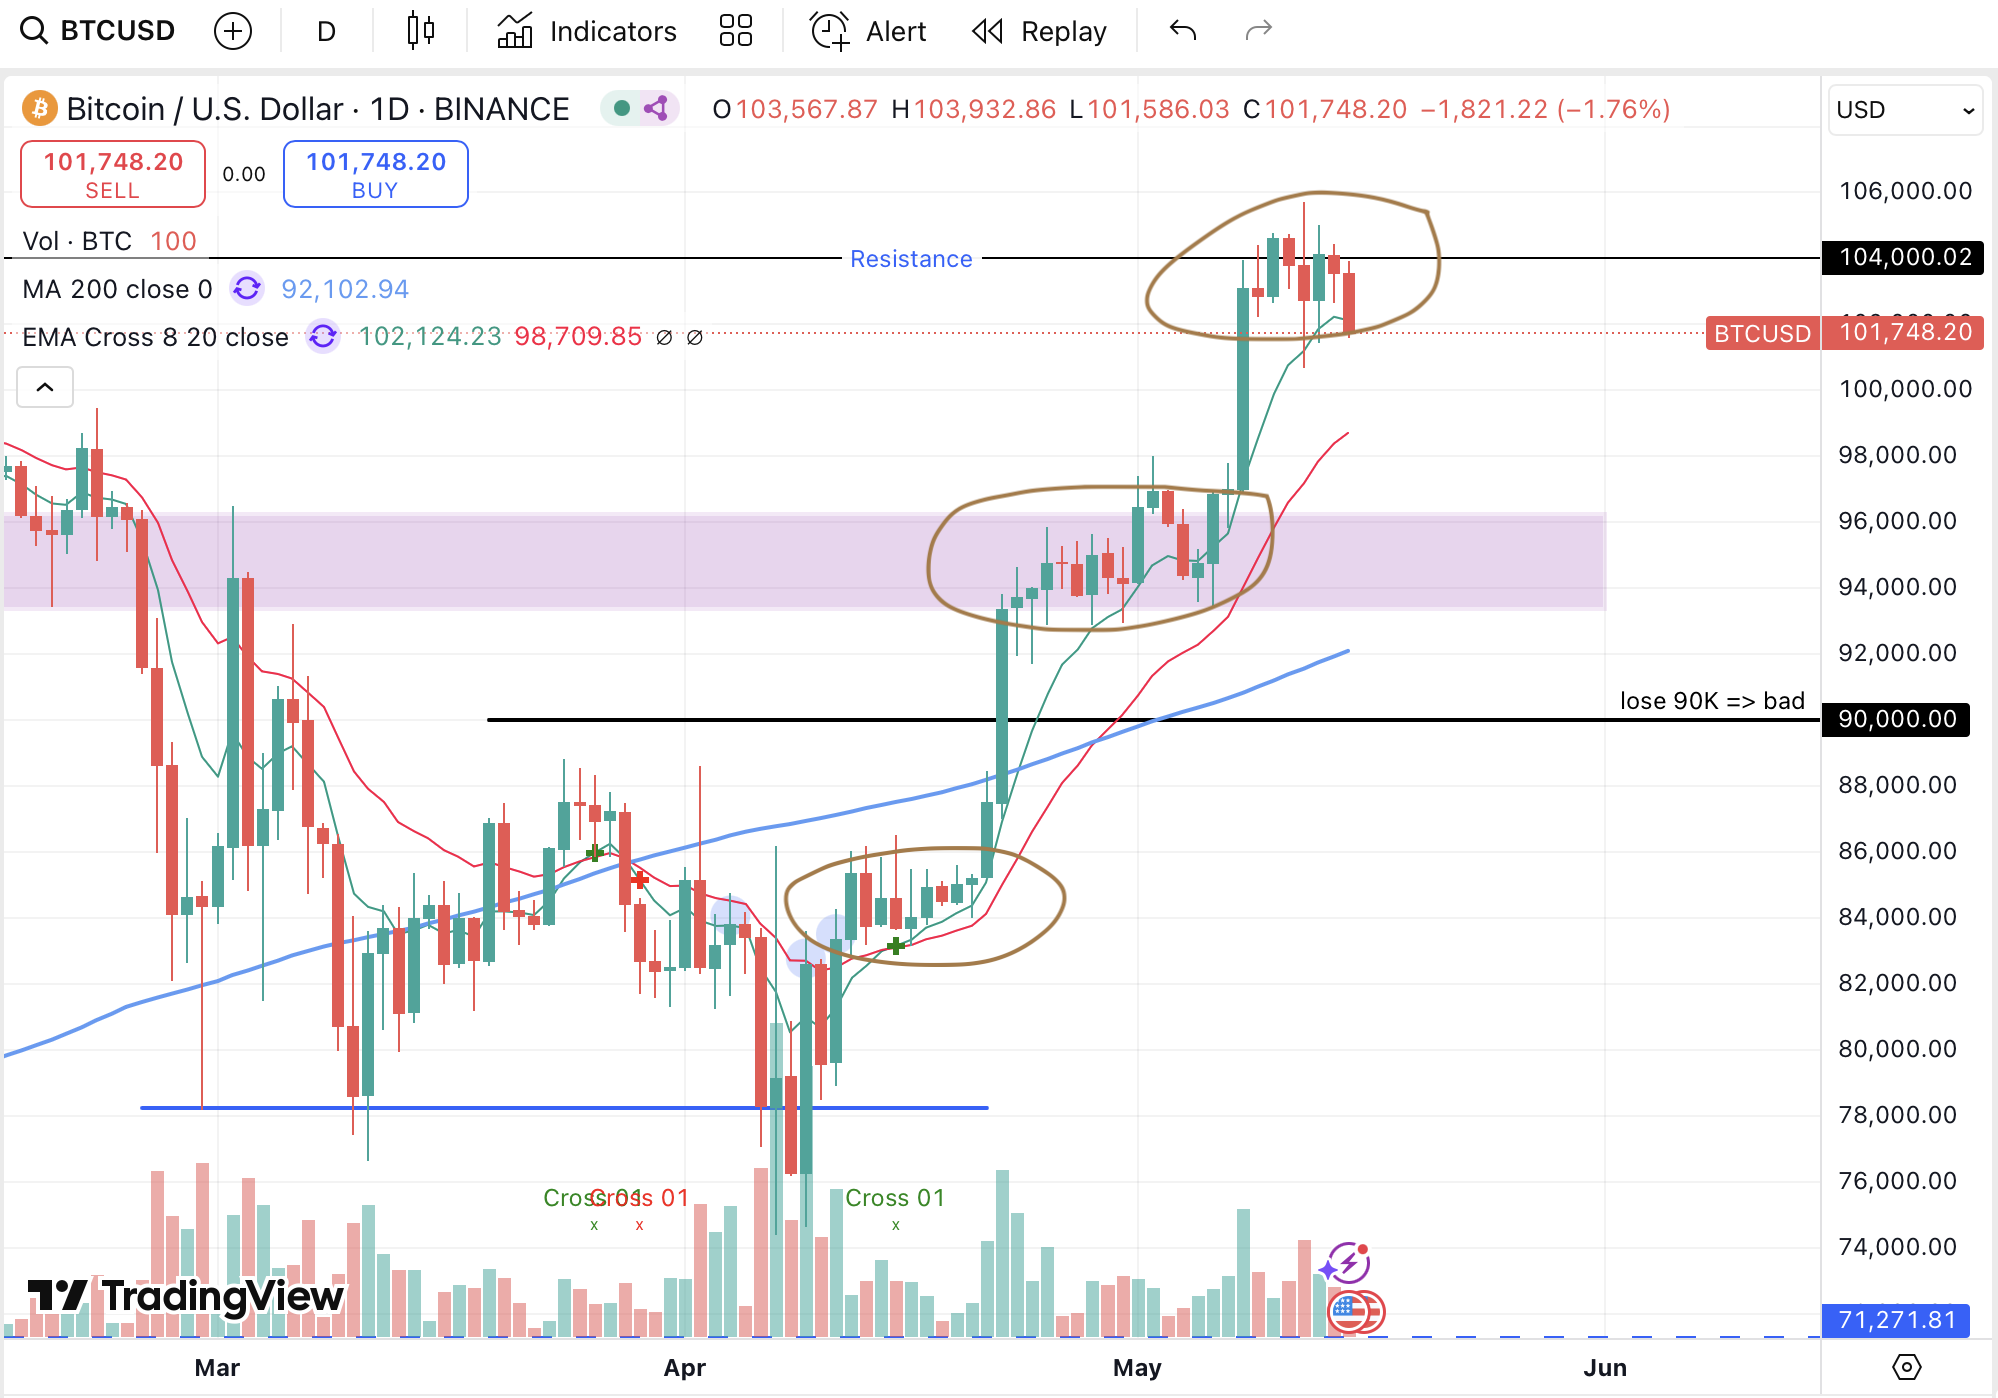
The chart below shows two support levels at $121.45 (dashed line) and $105.32 (solid line) respectively. In hindsight, $105.32 is a better support, but $121.45 served as a great support from 25 March 2025 and 11 days after. Even after things went from bad to worse, price only stayed below $121.45 for 6 days and then moved up and away from it.
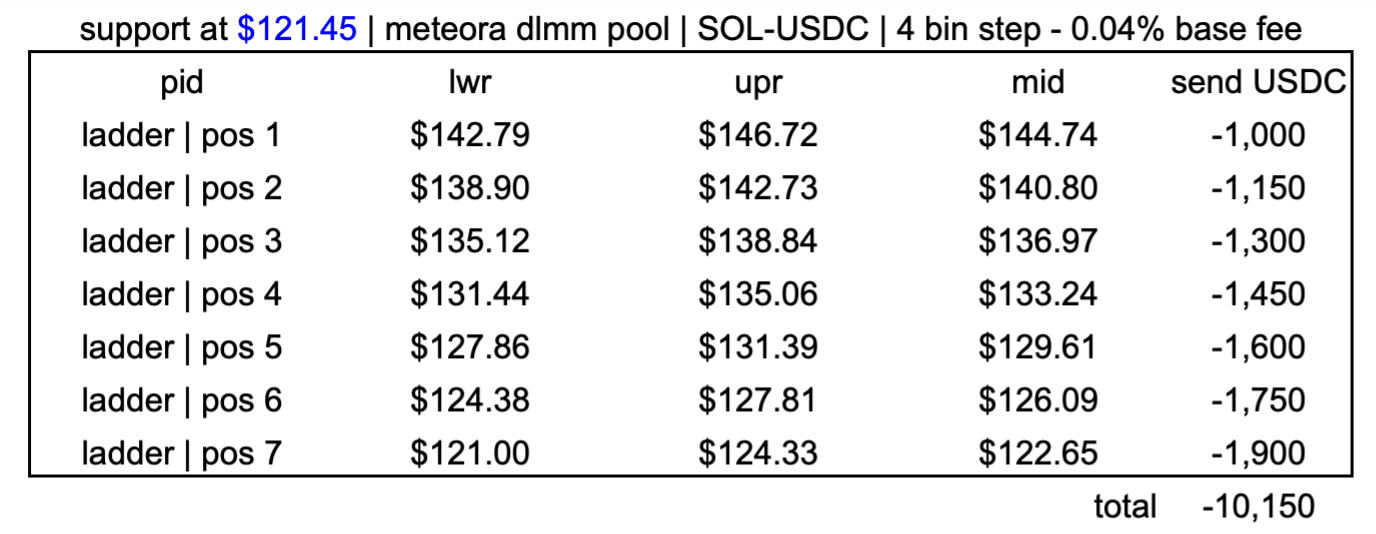
The following table shows a ladder of positions and USDC allocations when using $121.45 as support. There are 7 contiguous positions, with the first one getting 1,000 USDC and the last one 1,900 USDC. There is an increase of 150 USDC for each new position as price drops. A total amount of 10,150 USDC is required.
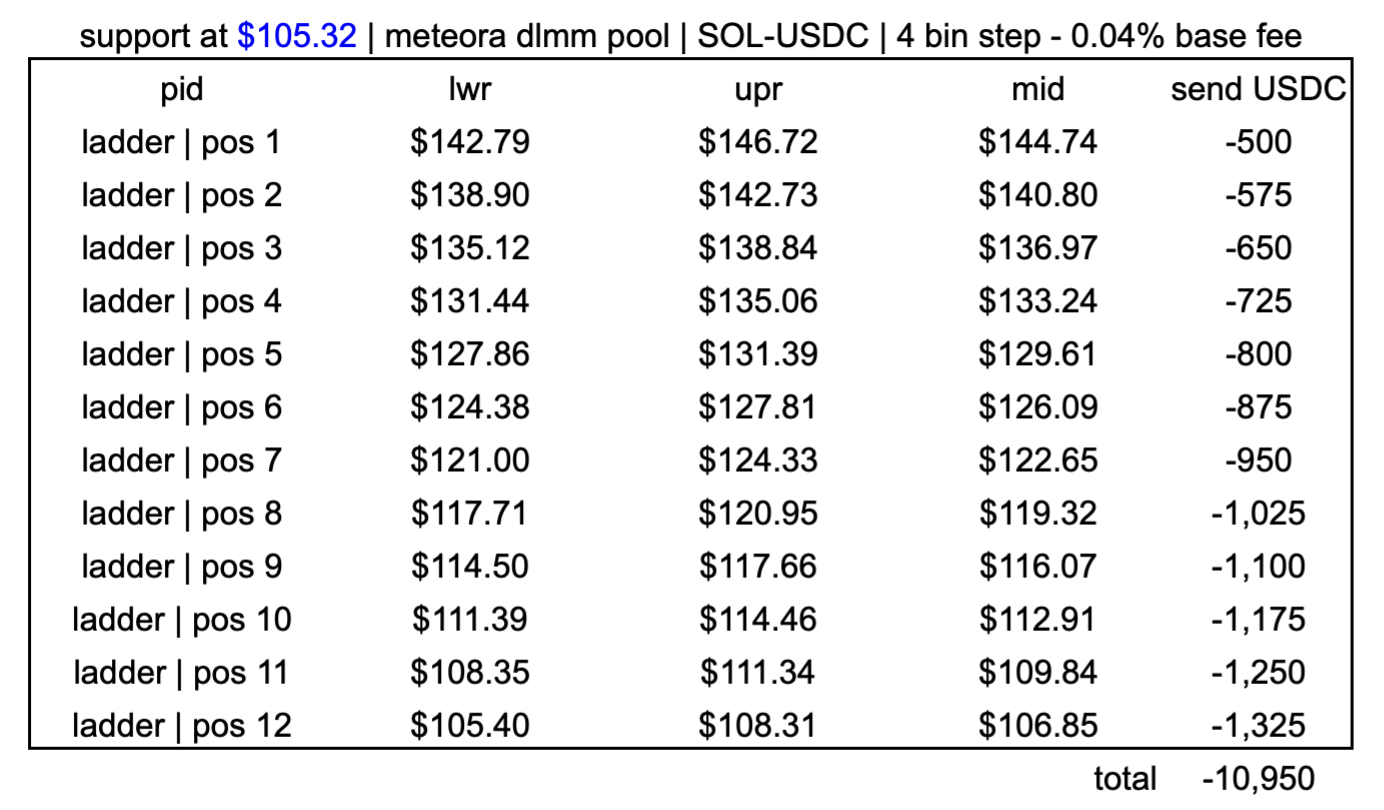
The next table shows a ladder of positions and USDC allocations when using $105.32 as support. There are 12 contiguous positions, with the first one getting 500 USDC and the last one 1,325 USDC. There is an increase of 75 USDC for each new position as price drops. A total amount of 10,950 USDC is required.
Notice that the amount of capital required slightly exceeds 10,000 USDC. This is not a problem since we can borrow USDC against SOL collateral on Kamino. When we run out of dry powder, we can close previous positions, withdraw liquidity in the volatile asset, supply the volatile asset to a safe lending market, and borrow USDC to open new positions. But this operation does become more difficult if price keeps dumping because we don’t want to get liquidated. For example, I ran out of dry powder near the support level at $121.45 and began opening positions with borrowed USDC. When price dropped below the support at $105.32, I looked at my already big loan-to-value ratio and decided not to borrow more to open any new positions. In hindsight, I should have done the opposite. But at the time, I feared the price might crash down to $80 or even $60, putting my collateral at risk. Always keep a margin of safety when borrowing.
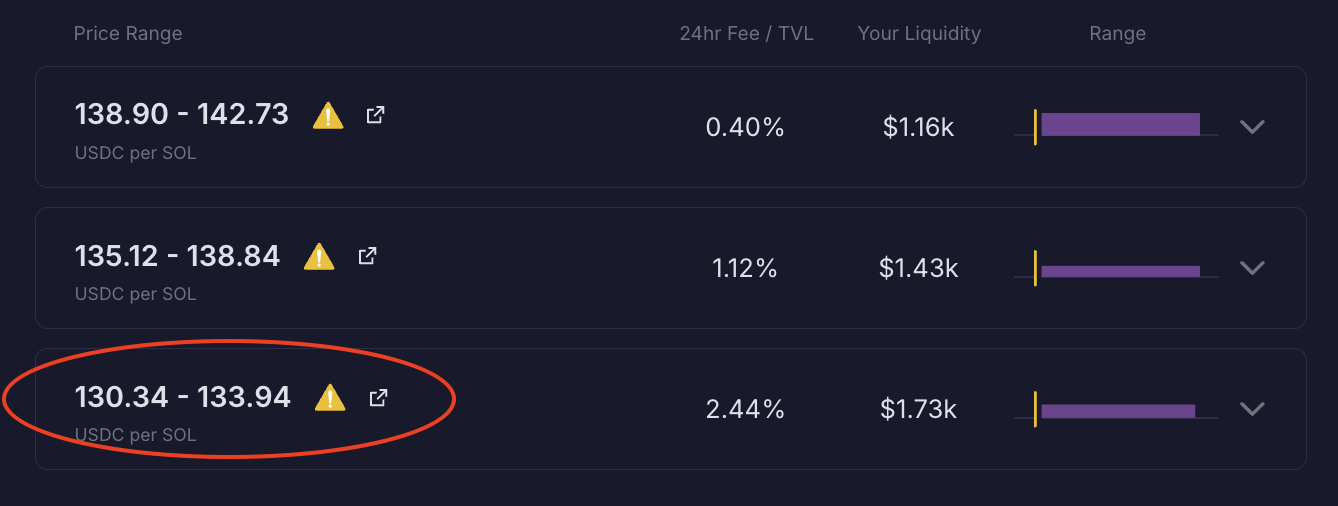
In practice, we rarely get to build a perfectly contiguous ladder of positions like the tables above because we open positions sequentially while following the price. The price may drop far below our last position’s range when we’re away— resulting in gaps. But that’s okay! While we miss out on some fees, we benefit from an even lower DCA entry price. For example, instead of opening the fourth position in the above tables between $131.44 and $135.06, I placed it between $130.34 and $133.94 because the price had already fallen to $133.94 by the time I checked.
 Having established a good strategy for declining prices, let’s now explore
how to best capitalize on the eventual recovery. First, let’s revisit the SOL
price chart we posted earlier. After bottoming near $100 between April 6-9,
the price began a sustained upward movement.
Having established a good strategy for declining prices, let’s now explore
how to best capitalize on the eventual recovery. First, let’s revisit the SOL
price chart we posted earlier. After bottoming near $100 between April 6-9,
the price began a sustained upward movement.
Naturally, we could only confirm this as a true rally in hindsight. When price
initially rebounded from the mid-$90s, there was a good chance that it was a
fake pump. Given my elevated loan-to-value ratio, I immediately unwound60
several recent positions and paid down USDC debt.
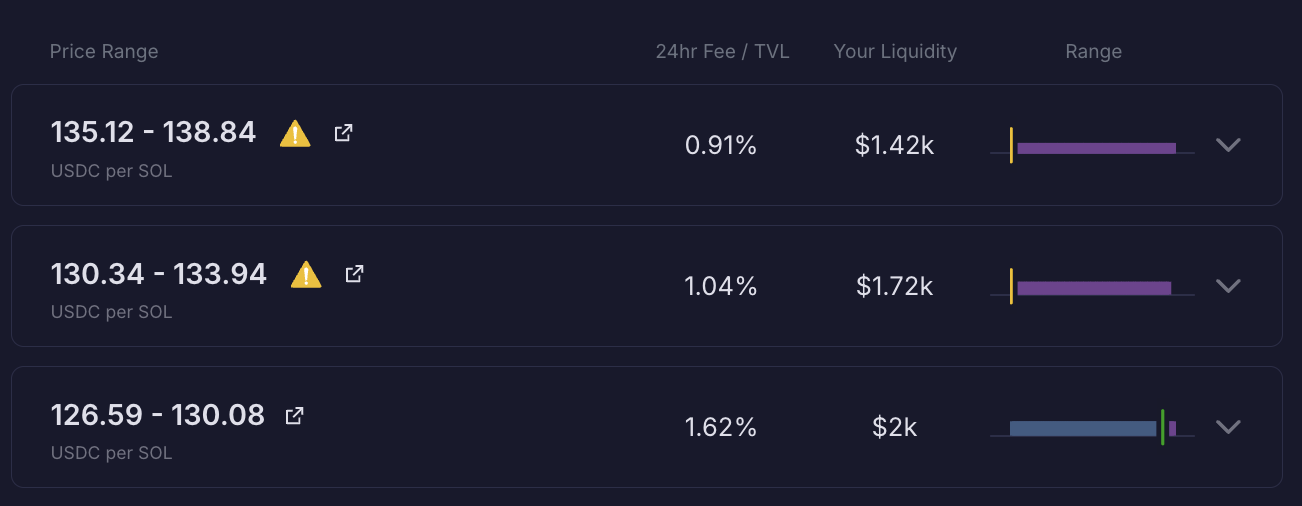
As price continued to rise and the upward trend is sustained, I began to unwind higher positions (opened at higher prices) instead of lower ones (opened at lower prices). For instance, the screen below shows three positions. I first unwound the top position ($135.12 - $138.84) in a 15-bin-step pool, and then the middle position ($130.34 - $133.94) in a 10-bin-step pool. At the time of the writing, the price of SOL is $171, I still haven’t unwound the bottom position ($126.59 - $130.08).
 This early in, early out (EIEO) approach is more profitable than last in, first
out (LIFO). This is because strong upward movements, especially following an
extended downtrend, are accompanied by both high trading volume and rapid price
appreciation. SOL, for instance, frequently demonstrates the following price
pattern in these conditions: a day of 8-12% jump, followed by several days of
consolidation (ranging around the new high), and then another day of 8-12% jump.
On the other hand, the high volume generates juicy yield even for wide-ranged
pools (10, 15, 16, 20, 50, or even 80 or 100 bin steps). To summarize, when
market turns bullish, we want to first unwind higher positions in wider-ranged
pools because this increases in-range duration and hence captures more fees.
After price puts in several big daily green candles, we can unwind lower
positions in either narrow-ranged pools if we are cautious and want to lock in
the capital gains or wide-ranged pools if we are greedy and believe price will
keep pumping.
This early in, early out (EIEO) approach is more profitable than last in, first
out (LIFO). This is because strong upward movements, especially following an
extended downtrend, are accompanied by both high trading volume and rapid price
appreciation. SOL, for instance, frequently demonstrates the following price
pattern in these conditions: a day of 8-12% jump, followed by several days of
consolidation (ranging around the new high), and then another day of 8-12% jump.
On the other hand, the high volume generates juicy yield even for wide-ranged
pools (10, 15, 16, 20, 50, or even 80 or 100 bin steps). To summarize, when
market turns bullish, we want to first unwind higher positions in wider-ranged
pools because this increases in-range duration and hence captures more fees.
After price puts in several big daily green candles, we can unwind lower
positions in either narrow-ranged pools if we are cautious and want to lock in
the capital gains or wide-ranged pools if we are greedy and believe price will
keep pumping.
8.2 General Instruction
In the last section, we demonstrated how to construct and unwind a ladder of CLP positions, using Meteora’s DLMM SOL-USDC pools and Kamino’s Borrow/Lend. Let’s summarize all the steps.
Construction
Study the price chart and draw strong supports. The goal is to identify two strong support levels. Ideally, if price falls, you want it to consolidate around support 1 and eventually bounce, and if it eventually breaks through support 1 and head down, you want support 2 to hold the line. Make sure you use the higher time frames: 1 month, 1 week, and 1 day.
Choose the pool with the highest yield. Look at the 24h Fee/TVL column, which pool sits at the top day after day? If this pool has a very narrow configuration61, go with the pool with the 2nd highest yield but a wider configuration.
Simulate tables of consecutive positions and USDC allocations. Starting at the current price, do a table for each support. Here are two examples:
If you want some margin of safety, don’t stop at the support, keep planning out
positions until 10 ~ 30% below the support. Ask yourself what loan-to-value ratio
will make you lose sleep and use it to back out the maximum amount of USDC you’d
want to borrow against your volatile coin collateral62.
Decide which table you will use as the blueprint of your position ladder.
Support 1 table is more aggressive than support 2 table. Go with the latter if
things look bad. By the way, past experience has taught me to use support 2
table more often, even when things don’t look bad yet.
TODO: make google sheet template.
Open the top two positions. Lend the remaining USDC. Because each position covers a narrow range and price is volatile, you are likely to earn more fees with two positions open at the same time and spend less effort managing them. Due to high exploit risks in money markets, stick to proven platforms like AAVE (EVM) and Kamino (Solana).
If price rises:
- If price goes up a little (say < 1%), do nothing and wait for price to fall.
- If price goes up by 1 ~ 2%, close both positions and re-open at higher prices.
- If price falls:
- Enjoy the fees.
- If price falls below the lower bound of position 2, close position 1 and lend the returned volatile coin. Withdraw USDC to open position 3. If price falls below its upper bound before you get to open it, simply open position 3 at the current price.
- If price keeps dumping, repeatedly close out-of-range positions, lend the returned volatile coin, borrow USDC if needed, and open new positions. Always keep two positions open at the same time.
- Watch your loan-to-value ratio closely. Avoid getting liquidated. Dead cat bounces are common during protracted downtrends. As a good risk management practice, when the market shows relief after steep decline, unwind a few positions and pay down debt, observe price action for a few days first, do not rush to open new positions.
Unwind
Eventually market will bottom and price will go up, presenting opportunities to unwind your positions. There are three approaches:
- Last in, First out (LIFO): Unwind the most recent positions first. Trade upside for safety.
- Early in, Early out (EIEO): Unwind earlier positions before recent ones. Balance upside and safety.
- Hodl till ATH (HTATH): Do not unwind any positions until the volatile coin’s price reaches all time high. Maximize upside and risk.
If price is on a tear, LIFO is the least profitable, HTATH is the most profitable, and EIEO gives good profits. But at the start of the reversal, we don’t know how price will move in the following days and weeks, so it’s best to combine the three approaches.
Use LIFO at the start of the reversal. Pay down debt with the recovered USDC. Observe price action to assess if the reversal is really here to stay.
Use EIEO as price climbs up. At this point, price has gone up some but not a lot and consolidated once or twice. Because there’s now more evidence showing the pump is not fake, you have more conviction to hold the volatile coins withdrawn from later positions. But because it’s still too early to tell if the uptrend will sustain, it’s wise to reduce risk by unwinding earlier positions in wider-ranged pools that offer a good yield.
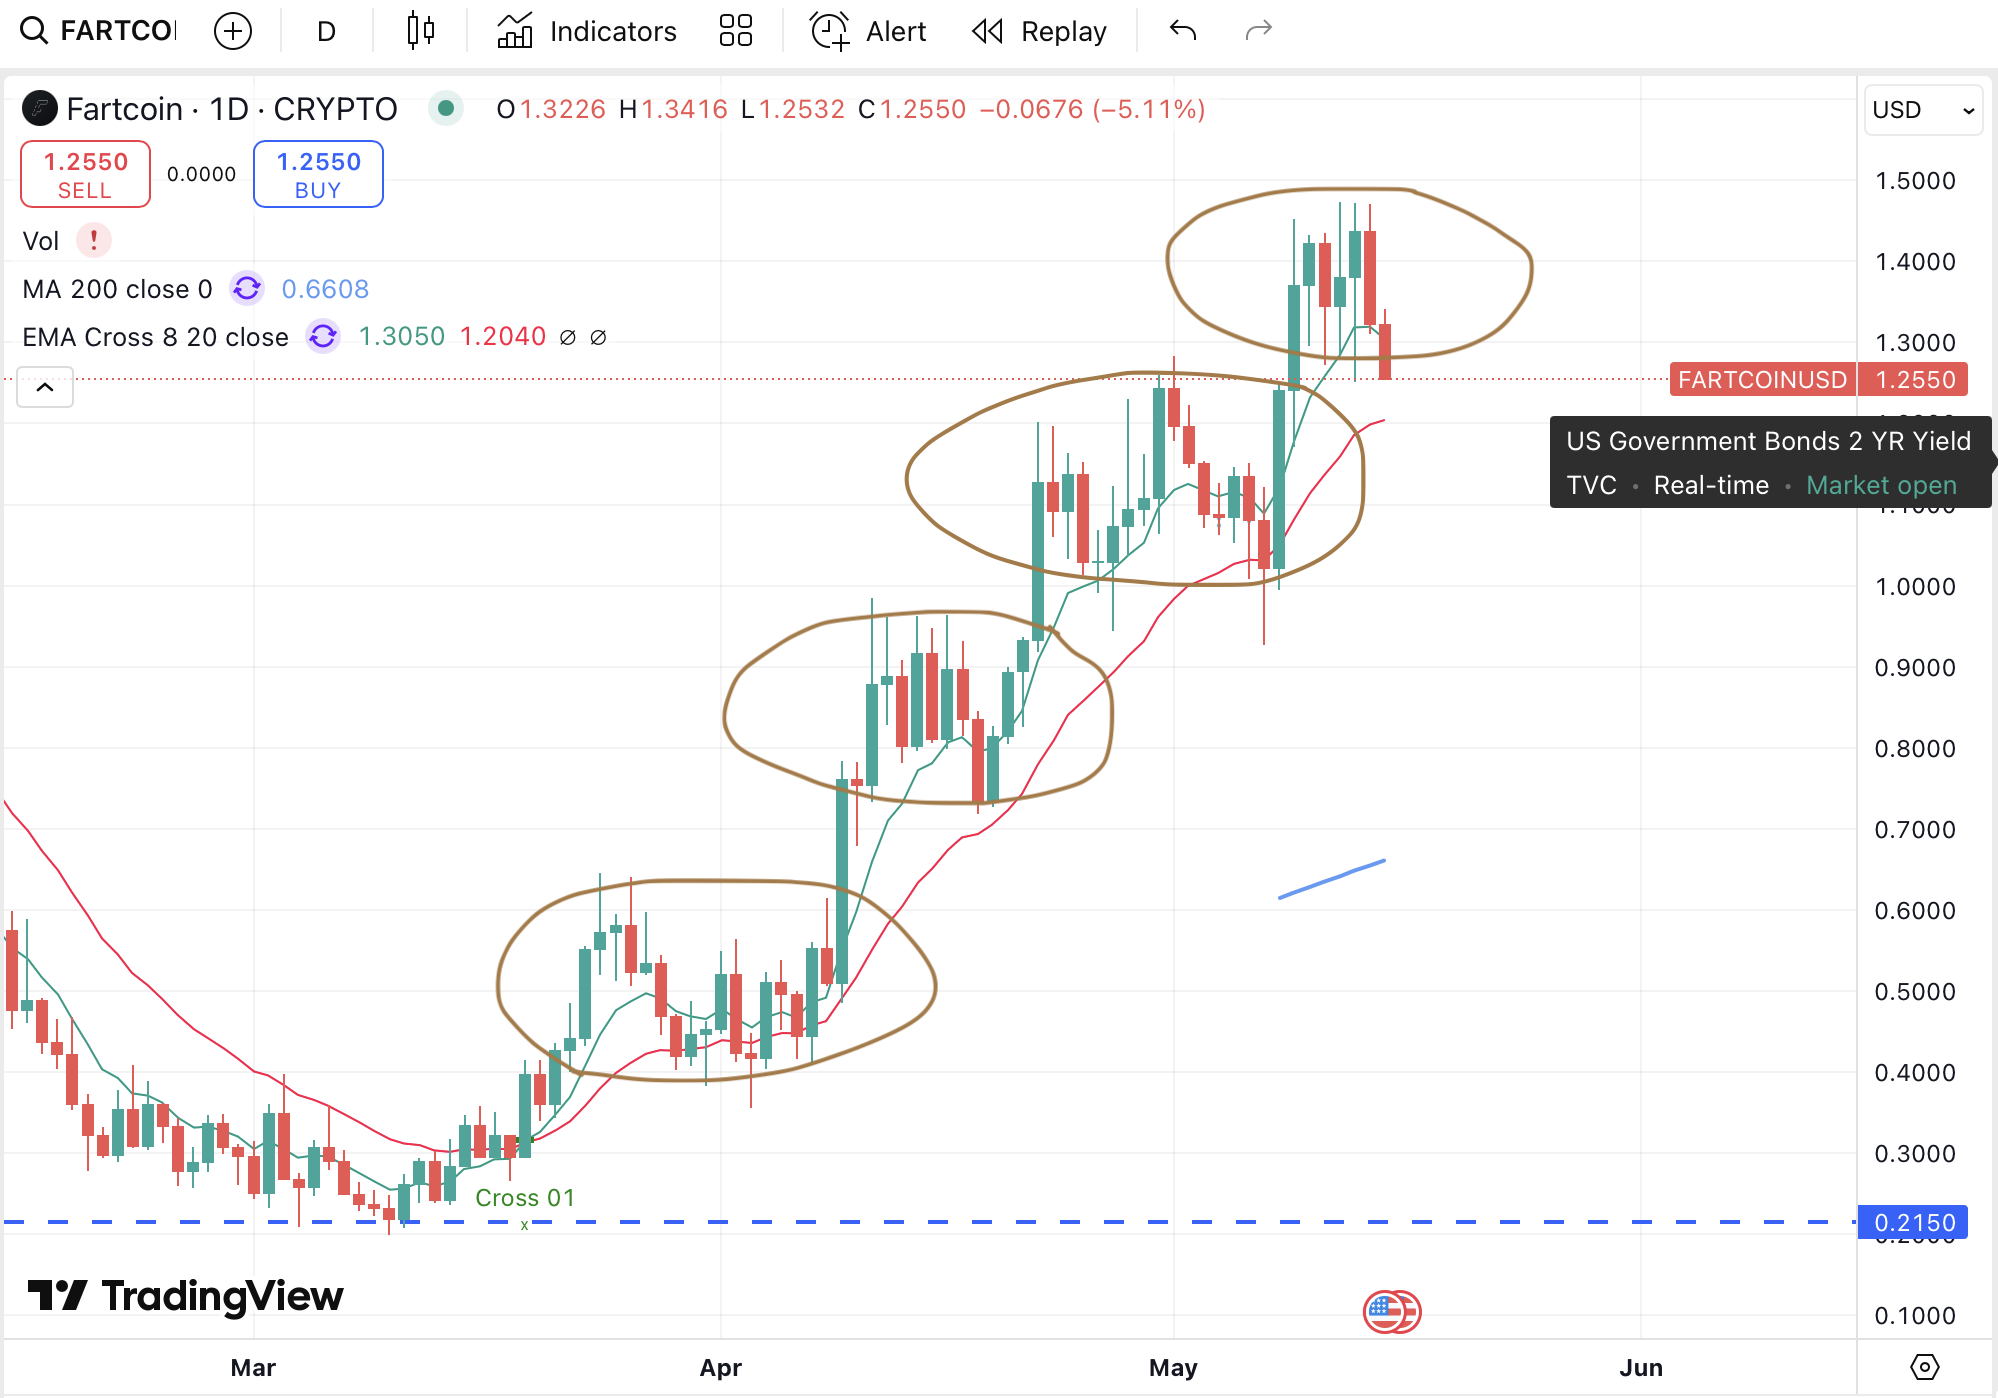
Use HTATH upon uptrend confirmation. On the daily chart, as soon as I see a big green candle (8%+ increase) followed by several days of consolidation (short candles going sideways) and another big green candle (8%+ increase), I conclude the rally will likely to stay and price can go much higher. The following charts demonstrate this. I typically pause position unwinding after either the second or third strong bullish candle, which marks the beginning or the end of the second consolidation region. And I maintain exposure to the volatile coin until upward momentum shows signs of exhaustion, at which point, I will unwind the remaining positions.
The End.
In this chapter, we described an LP strategy tailored for extended downtrends followed sustained recoveries. In the next chapter, we will explore LP strategies for ranging market conditions. Stay tuned.
For example, cbBTC-USDC is a good pair to start with. You can find it on Meteora (Solana) or Uniswap (Base or Arbitrum).↩︎
If you enter a USDC amount while keeping SOL amount 0 (default), Meteora will automatically set up a position of 69 bins with the upper limit at the current price:
 ↩︎
↩︎Kamino (https://app.kamino.finance/) is a money market on Solana. People call it AAVE on Solana, but it’s less battle-tested than AAVE. AAVE is not on Solana.↩︎
By unwinding a position, I mean recovering the USDC liquidity (or more) that was provided. When we open a one-sided position with USDC and price falls below the position’s lower bound, we can close the position and withdraw 100% liquidity in SOL plus fees—50% in SOL and 50% in USDC, and use the returned SOL in other DeFi applications. When SOL’s price goes up again and exceeds the DCA purchase price, calculated as the geometric mean of the position’s lower and upper bounds, we can recover the initial USDC liquidity by directly selling the withdrawn SOL. Alternatively, we can do it with another one-sided position: (1) Create a new position with bounds whose geometric mean matches or exceeds the DCA purchase price. (2) Deposit the withdrawn SOL into this new position. (3) Close the position once price goes above its upper bound, withdrawing full liquidity in USDC and fees (50% USDC, 50% SOL).↩︎
The configuration with the fewest bin steps is the narrowest for a given pair. For SOL-USDC, that’s 1 bin step; for cbBTC-USDC, that’s 4 bin steps; for Fartcoin-USDC, that’s 10 bin steps.↩︎
To calculate the amount of volatile coin each position will return if price falls below its lower bound, we simply divide the USDC send amount by the mid or DCA price, which is the geometric mean of the position’s range bounds. We can then multiply the amount of volatile coin by the minimum of all the positions’ lower bounds to get a conservative estimate to the value of the volatile coin.↩︎
Welcome
Log in to access this book.